Alarm with visualization
In this tutorial you will learn how to realize and visualize an alarm in the COMEXIO OS via graphical programming.
This tutorial is based on the tutorial
“Basics of Graphical Programming”
on.
Step one:
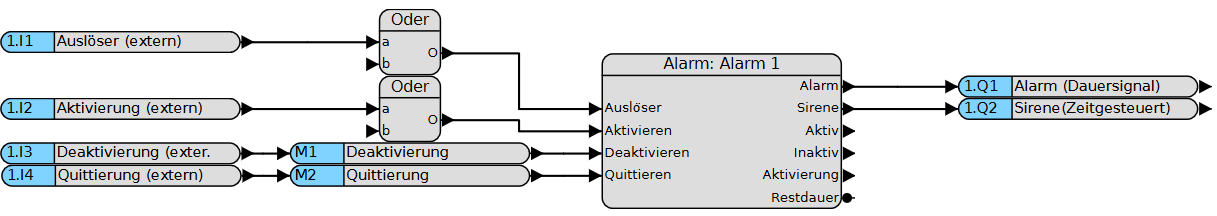
For this tutorial “Alarm” we used four inputs, two digital flags and two outputs.
• Inputs: “Trigger (external)”, “Activation (external)”, “Deactivation (external)” and “Acknowledgement (external)”.
• Flags: “Deactivation” and “Acknowledge”.
• Outputs: “Alarm (continuous signal)” and siren (time controlled)”.

Step two:
The suitable block we use is called the “alarm block” (in the list of logic blocks).

Schritt 3:
Nun verbinden Sie die Eingänge, Merker und Ausgänge mit dem Alarm-Baustein.
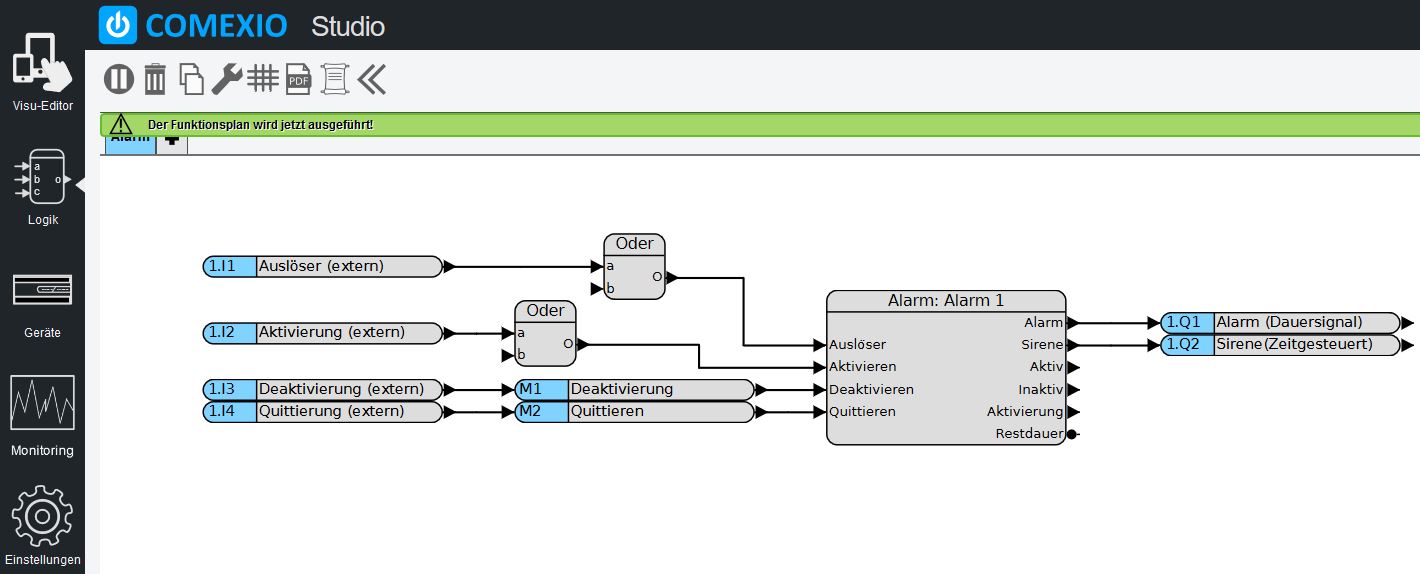
Step four:
Then activate the function chart. If you see the message “The function chart is now being executed” in green and the tab has turned blue, you have implemented the “Alarm” function!
Step five:
Now click on “Visu-Editor” in the menu bar at the top left to create the visualization.

Step six:
Now create a new dashboard for the alarm or use an existing one. Note the grid size and adjust it if necessary.
The automatically created Visu module for the alarm can be found in the toolbar under Special. Now drag it into the grid.

Congratulations, you have successfully created an alarm with visualization!
