Irrigation with visualization
In this tutorial you will learn how to implement and visualize irrigation in the COMEXIO OS via graphical programming.
This tutorial is based on the tutorial
Step one:
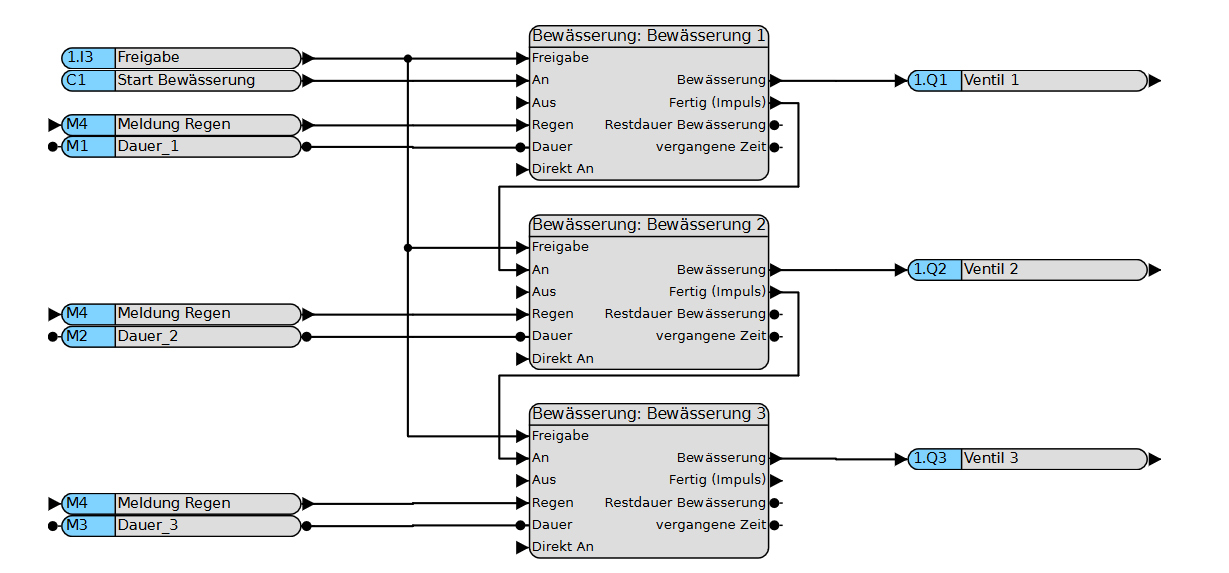
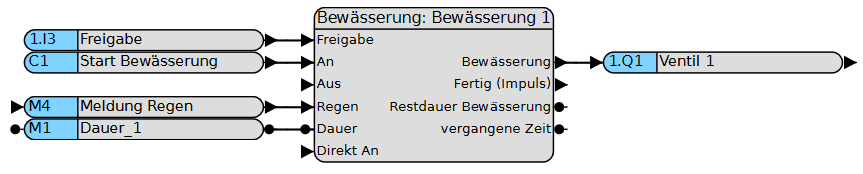
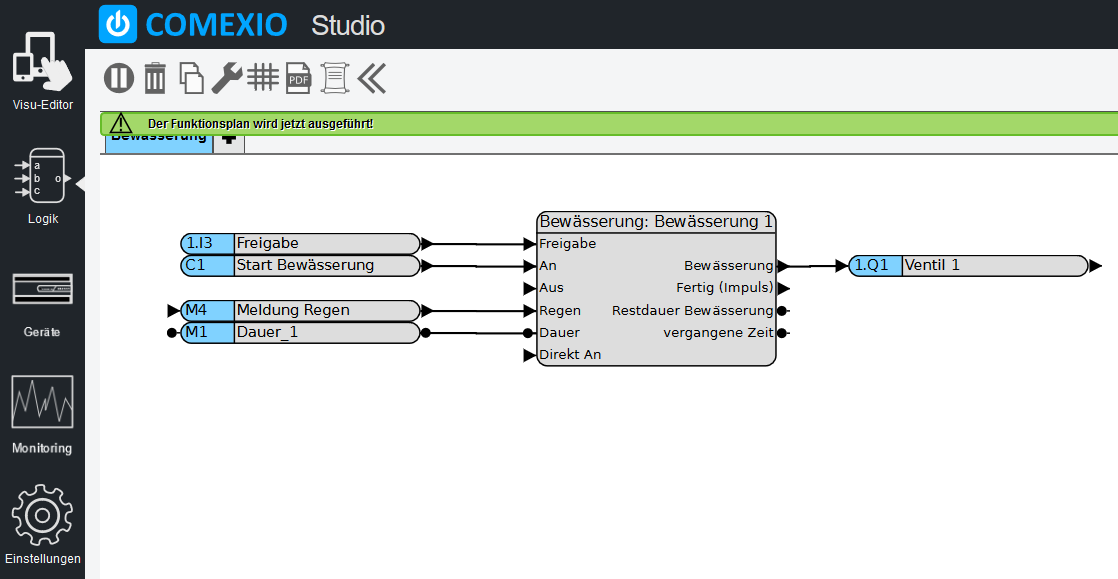
For this tutorial “Irrigation” we use an input, a calendar function, a digital flag and an analog flag as well as an output.
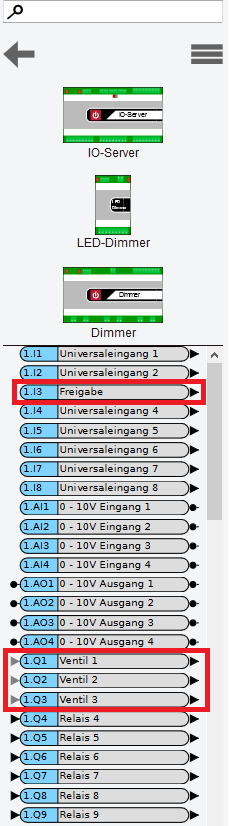
• Inputs: “Enable”,
• Flag: “Rain message” this signal is transmitted by a rain sensor or the weather module (digital flag), “Duration_1” is the desired watering duration in seconds (analogous to flag).
• Calendar function: “Start watering”.
Step two:
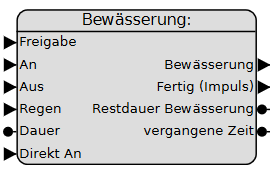
The suitable block we use is called “Irrigation” (in the list of logic blocks).
Step three:
Now connect the inputs, flags and output to the watering module.
Step four:
Then activate the function chart. If you see the message “The function chart is now being executed” in green and the tab has turned blue, you have implemented the “Irrigation” function!
Step five:
Now click on “Visu-Editor” in the menu bar at the top left to create the visualization.
Step six:
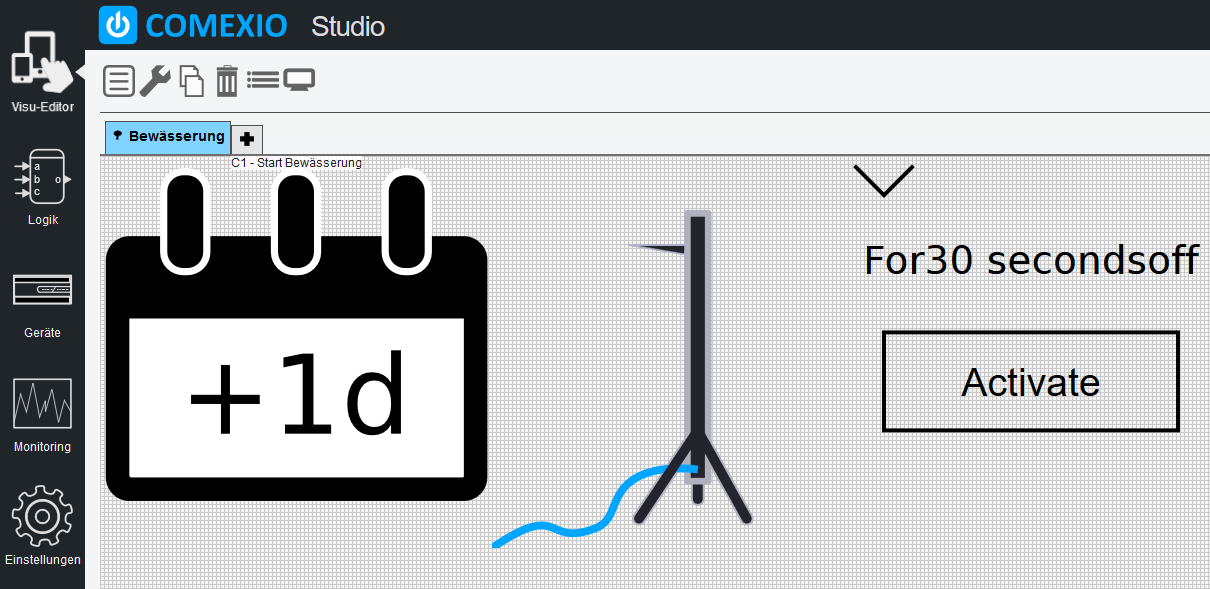
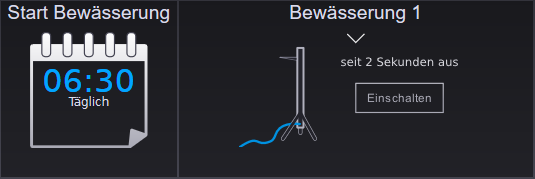
Now create a new dashboard for watering or use an existing one. Note the grid size and adjust it if necessary.
The automatically created Visu module for watering can be found in the toolbar under Special. Now drag it into the grid.
Add the calendar function to the visualization if you want to adjust the start times in the visualization.
Congratulations, you have successfully created an irrigation with visualization!
For example, the next one can be started via the “Finished (pulse)” output of the irrigation module.